Table 用于展示行列数据。
基本使用
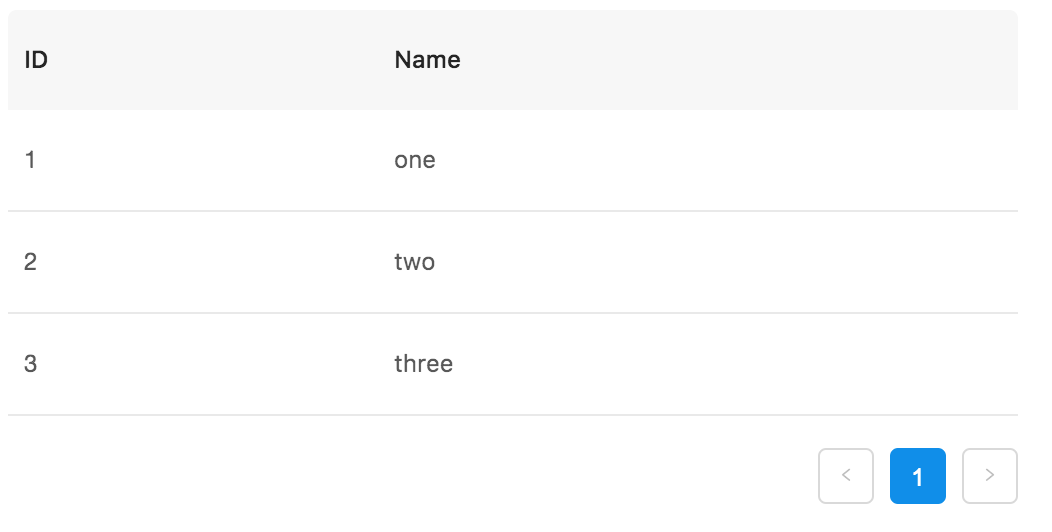
指定表格的数据源 dataSource 为一个数据组, 并指定表格列的配置描述columns即可。
 1
 2
 3
 4
 5
 6
 7
 8
 9
10
11
12
13
|
const dataSource = [{id:1, name: 'one', color: '#fff'},
        {id:2, name: 'two', color: '#eee'},
        {id:3, name: 'three', color: '#ddd'}];

const columns = [{
   	title: 'ID',
   	dataIndex: 'id',
   }, {
   	title: 'Name',
   	dataIndex: 'name',
}];

<Table dataSource={dataSource} columns={columns} />
|
运行结果:
行背景
默些时候, 需要根据行数据,来指定每行拥有不同的背景色。此时,可以使用Table.rowClassName来指定。rowClassName指定表格行的类名,类型是:Function(record, index):string, 其中record参数就是每行的具体绑定的数据。
1
2
3
4
5
|
<Table
    columns={columns}
    dataSource={this.state.data}
    rowClassName={(record) => record.color.replace('#', '')}
    rowKey={record => record.id}/>
|
rowClassName函数替换每行数据中color的值,将#替换为‘’, 剩下部分作为该行的class名返回。此时,需要制定相应的CSS样式:
 1
 2
 3
 4
 5
 6
 7
 8
 9
10
11
|
.fff {
  background: #fff;
}

.eee {
  background: #eee;
}

.ddd {
  background: #ddd;
}
|
运行效果:

参考
1、https://jsfiddle.net/2b2376a4/
2、https://ant.design/components/table-cn/